Analysis
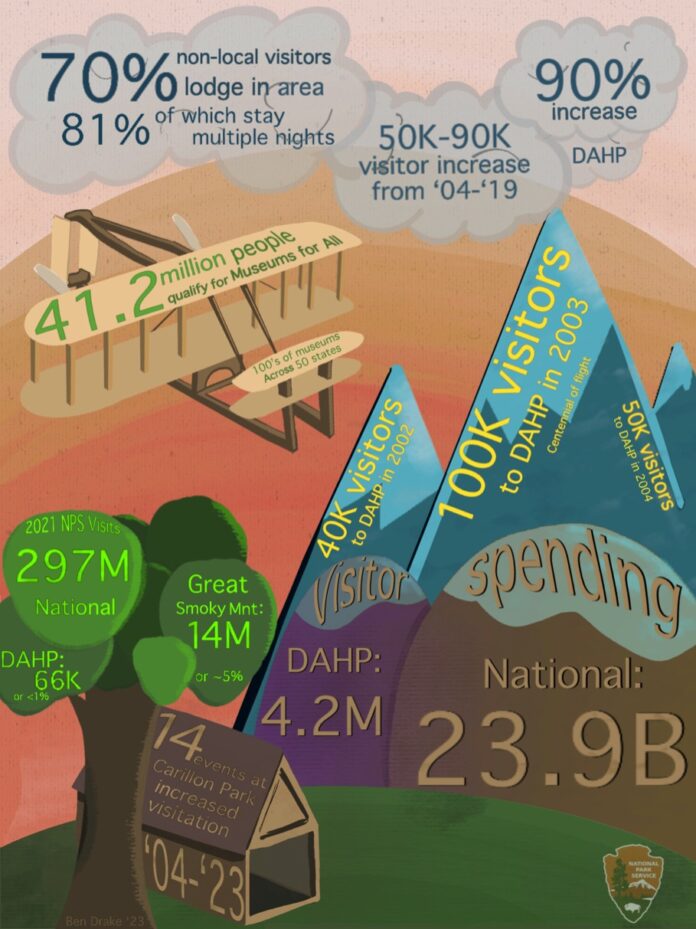
I chose to highlight the peak visitor count of around 100,000 in 2005 to illustrate how the events surrounding the centennial of flight drove up visitor numbers compared to the years prior and after. Other than this drastic spike visitor numbers at Dayton Aviation Heritage Park have been steadily on the rise, growing by ~90% from 2004 to the Covid-19 shutdown. Numbers have returned to normal by 2022 with DAHP counting 81,000 visitors. During this span of time DAHP had noted 14 events taking place at Carillon Historical Park alone that attracted guests to the site. These figures help to illuminate the benefit of after hours/off site events.
I chose to highlight the visitor spending, both nationwide and in Dayton, as well as how many visitors lodge near NPS sites to illustrate some of the ways that bringing people into the areas can affect economies at different scale.
The number of people who qualify for reduced or free museum admission through Museums for All was selected to illustrate a portion of the population who may have restricted financial access to parks and museums. It is for a similar reason I listed the 2021 visitor figures at our partner sites, the busiest National Park, and nationwide. Not everyone has geographic access to all of these parks, but these figures show how many fewer people have direct access to DAHP and as such the story of the Wright brothers and Dayton’s history. I felt it was important to include multiple forms of accessibility here.
Finally I chose to organize this information in this style because it meshes well with official material from the NPS. My layout references the NPS logo in some of its iconography and in its colors. Rather than display a flat layout of graphs, this scenic infographic not only represents some of the NPS’ stats but also the nature and history celebrated by the organization.
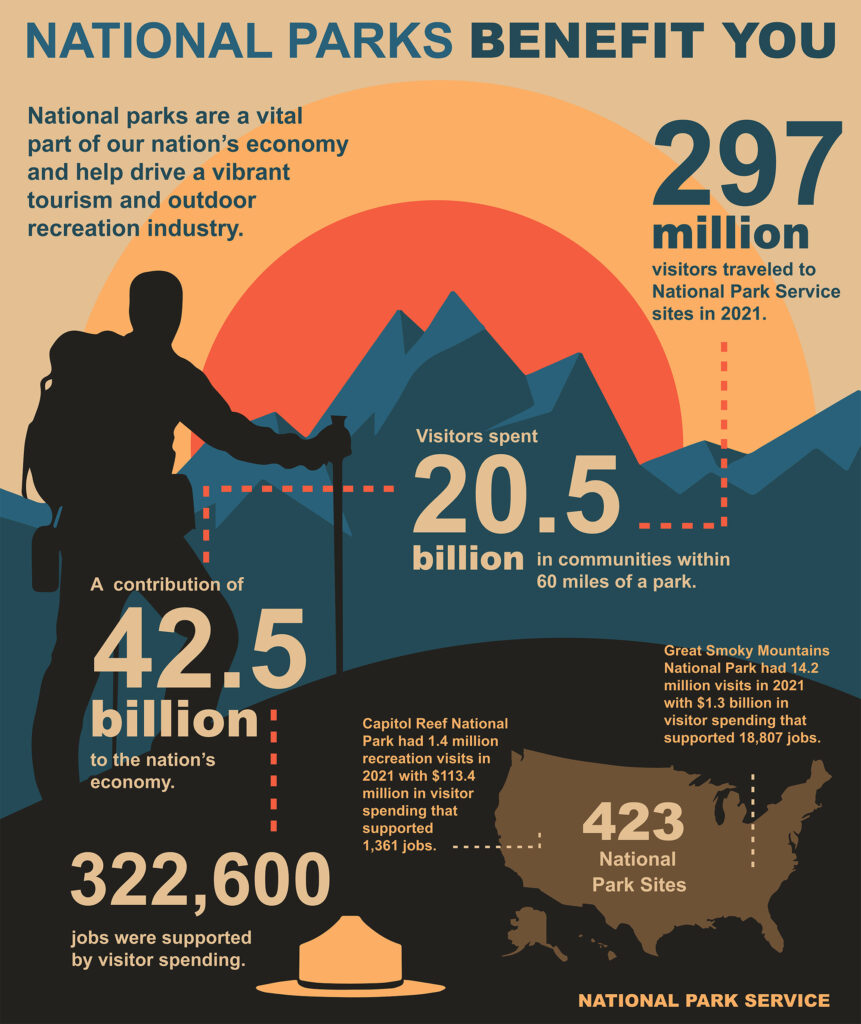
NPS Reference/Draft


Sources
Irma.nps.gov. (n.d.-a). https://irma.nps.gov/DataStore/DownloadFile/691038
National Park Service History Electronic Library & Archive. (n.d.-b). http://npshistory.com/publications/daav/gmp-amend-2022.pdf
Participating museums. Participating Museums – Museums for All. (n.d.). https://museums4all.org/participating-museums/#
U.S. Department of the Interior. (n.d.-a). National Park visitor spending contributed $42.5 billion to U.S. economy. National Parks Service. https://www.nps.gov/orgs/1778/vse2021.htm
U.S. Department of the Interior. (n.d.-b). Stats report viewer. National Parks Service. https://irma.nps.gov/Stats/SSRSReports/Park%20Specific%20Reports/Annual%20Park%20Recreation%20Visitation%20Graph%20(1904%20-%20Last%20Calendar%20Year)?Park=DAAV
U.S. Department of the Interior. (n.d.-c). Stats report viewer. National Parks Service. https://irma.nps.gov/Stats/SSRSReports/Park%20Specific%20Reports/Monthly%20Visitation%20Comments%20By%20Park?Park=DAAV


