by See.Sense, 2018
https://seesense.cc/blogs/hub/making-cycling-better-in-dublin
DUBLIN ROUNDUP
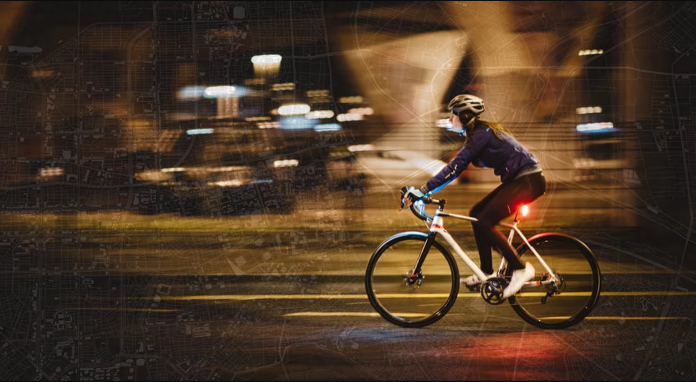
In what is the world’s largest connected cycle light trial, with over 1,500 applicants, a total of 500 cyclists received ICON lights in exchange for their agreement to collect and share their anonymised and aggregated insights. The collaboration with Dublin City Council and Smart Dublin came about through our successful submission to both a Phase 1 and 2 Small Business Innovation Research (SBIR) challenge.
Over 6,862 journeys were made with 33,942km travelled throughout the trial period.

WHAT WE DID
WE PROVED CYCLING IS FASTER!
On Monday 5th February 2018, RTE hosted a repeat of the Great Prime Time Transport Race, where Prime Time reporters raced across Dublin during peak commuter time to see which mode is faster- the Luas, bus, or car. The time taken for each was then compared with the results being aired on RTE Primetime.
Our friends at Dublin Cycling Campaign challenged the cyclists from the See.Sense city cycling trial to join in on the race (by bicycle of course!) and collect some data along the way so our data scientist could analyse the results side by side.
Each journey commenced at 08:15am on Monday morning. For a distance of 4.4km, it took 43mins in a car, 58mins by bus and over an hour using the Luas. But what if you cycled the same route? No surprises for our trial participants – it only took 23mins!

REPRESENTATIVE POPULATION
Yet again we were able to collect data on a representative sample of Dublin’s commuting population with the majority of our journeys occurring on weekdays and at peak commuting times.

WE MODELLED JUNCTIONS: CHRISTCHURCH JUNCTION
Through our data we were able to model the movements of cyclists through a number of key junctions in the city including Christchurch Junction. We were able to map the prominent movement patterns alongside calculating the average dwell times and likelihood of stopping experienced by cyclists travelling in north, south, east, west direction. This information can now be used to improve conditions for cyclists and improve their experience as they navigate key junctions in the city.

WAIT TIMES AND LIKELIHOOD OF STOPPING

WE CRASHED
Through our perception data which was collected via in-app surveys at the end of each ride our attention was brought to an incident in which one of our participants was unfortunately knocked off their bike. When we looked into our data we were able to see where the incident occured with the two spikes in the graph represented where the cyclist was hit and then again when the bicycle was picked up and set (rather roughly!) against a nearby wall. Over time we would be able to map incident hotspots through the city and work with authorities to improve conditions for cyclists.

WE MAPPED ROAD SURFACE
Through the course of the trial we were able to produce the visualization below that not only shows the relative volume of cyclists using the network but also highlights areas of road roughness with orange and red data points showing areas where the road is rough indicating likelihood of potholes and a less pleasant cycling experience.

SUMMARY
Through our work in Dublin we have empowered local cyclists to act as catalysts for change by sharing their experiences of cycling in the city. The insights generated can now be used to direct resource and investment more effectively in Dublin’s growing cycling infrastructure. This successful collaboration will now act as a blueprint for future projects in cities around the world and as always our thanks go to the trial participants who cycled throughout the winter to help us better understand their city.
Much like the map of Columbus, this system helps provide planner with accurate, real-world data collected from the people that make use of existing infrastructure. This allows them to identify opportunities for improvement more quickly and efficiently. A system like this could easily be rolled out in any city worldwide and is a great example for other locales that struggle in this area of research.


