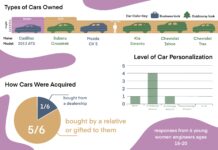
In order to collect survey information, I visited a variety of popular tailgating locations on OSU gamedays. I looked for tailgates that had an electric vehicle on site, and spoke to the owners of those vehicles about participating in a research survey. Once they agreed, I had them scan a QR code to answer my survey questions.
My survey provided me with a variety of useful information, especially being able to locate specific issues with frunk user experiences and relate those issues to user demographics. I was also able to relate those demographics to how often they experience these problems, and how often they attend tailgates where these problems take place. Other useful information from the survey included how users felt about their current vehicles, why they purchased them, and what they used them for on a daily basis.
Reference:


