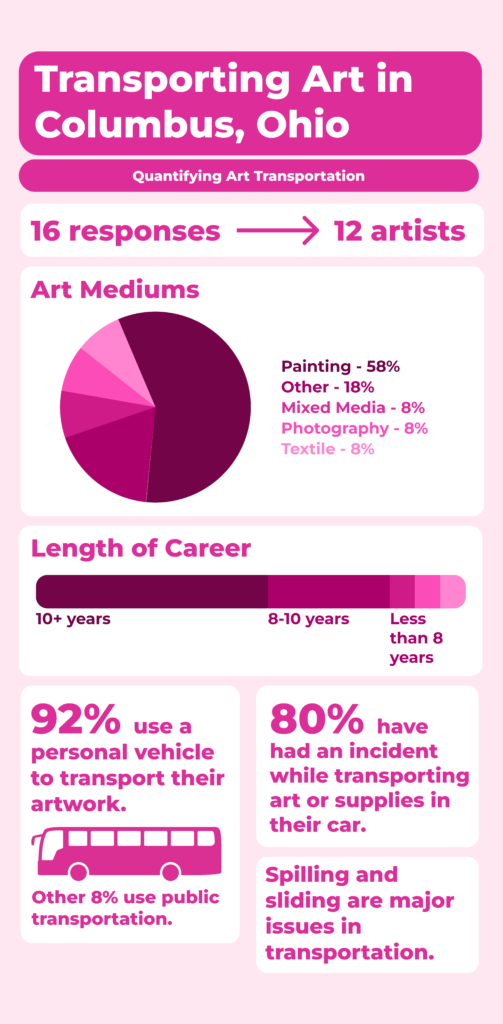
My survey asked a variety of questions relating to my respondent’s demographics as an artist as well as how they transport their art and if they’ve had any incidents in that process. The provided link will take you to a preview version of the survey, which won’t collect responses. I distributed my among peers in the Art Department at The Ohio State University, through my personal social media, and through the Urban Arts Space social media platforms. My survey is still in the distribution stage at the time of writing this article and a final version can be found here.
I utilized a survey because I felt it was best suited for asking a lot of different people the same set of questions and compiling data from that variety of perspectives. I asked my chosen questions with the intention of providing respondents with a platform to anonymously discuss any issues they have had transporting art. The questions were formulated with assistance from ChatGPT. My approach utilized a variety of multiple choice and free response options to help respondents formulate their thoughts without forcing them to give incorrect or untrue responses. At the end of the survey I give respondents the ability to provide their email so that I could contact them and ask further questions about my topic. I plan to do this in the future stages of my primary research.
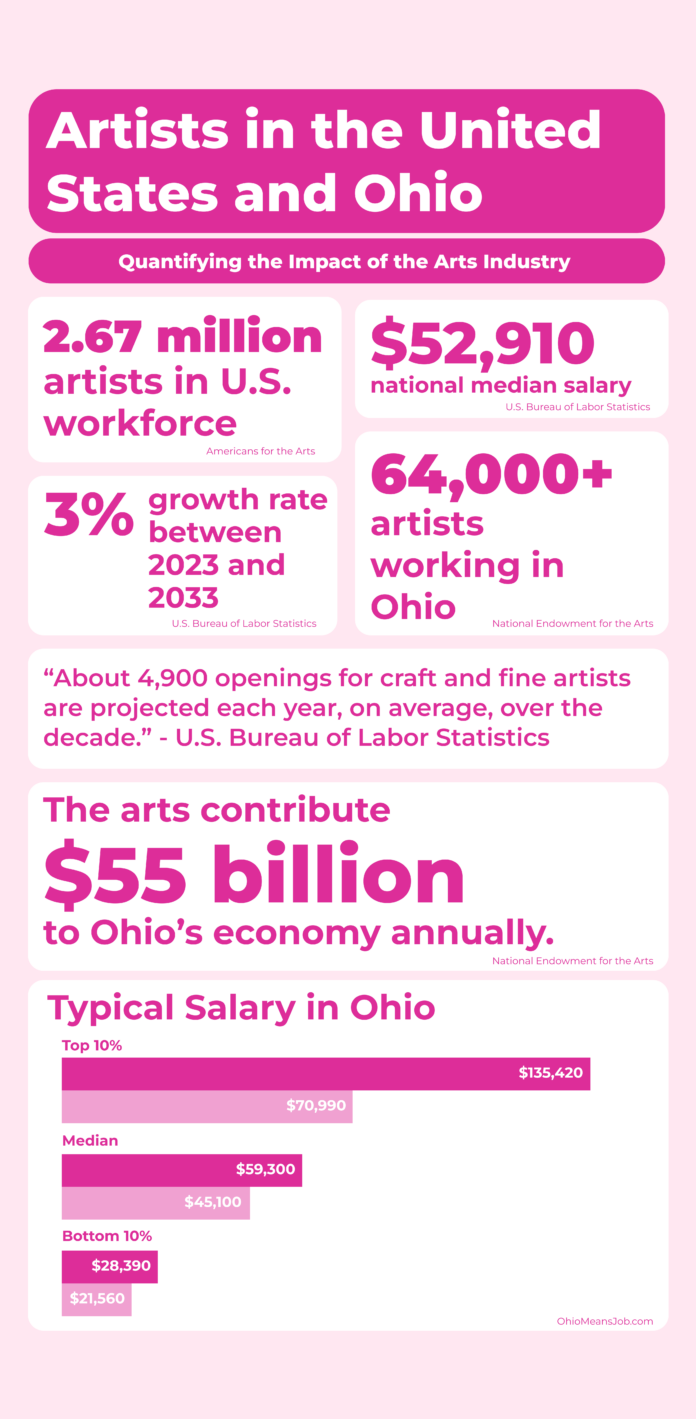
The data visualization from my survey points out some key takeaways from my survey. Many artists in the Columbus area have had long-standing careers in the arts and thus many of them have had incidents when transporting artworks and supplies. Across mediums, spills and shifting were identified as main pain points in the transportation process.
References
- Americans for the Arts. (2023) Artists in the U.S. Workforce: 2007-2022. https://www.americansforthearts.org/sites/default/files/documents/2023/Artists%20in%20Workforce%202023%20%282022%20data%29.pdf
- National Endowment for the Arts. (2022). Artists in the Workforce: National and State Estimates for 2015-2019. Arts Data Profile Series. https://www.arts.gov/impact/research/arts-data-profile-series/adp-31
- OhioMeansJobs.com. (n.d.). Fine Artists, Including Painters, Sculptors, and Illustrators. https://jobseeker.ohiomeansjobs.monster.com/ExploreIt/CareerDetails.aspx?user=mnm&Code=27101300
- Tebben, S. (2022). Study of Ohio arts industry during pandemic shows big hits to state economy. Ohio Capital Journal. https://ohiocapitaljournal.com/2022/04/14/study-of-ohio-arts-industry-during-pandemic-shows-big-hits-to-state-economy/
- U.S. Bureau of Labor Statistics. (2024) Craft and Fine Artists. Occupational Outlook Handbook. https://www.bls.gov/ooh/arts-and-design/craft-and-fine-artists.htm#:~:text=in%20May%202023.-,Job%20Outlook,force%2C%20such%20as%20to%20retire.


