MARCH 02, 2021
Published in the U.S Bureau of Labor Statistics
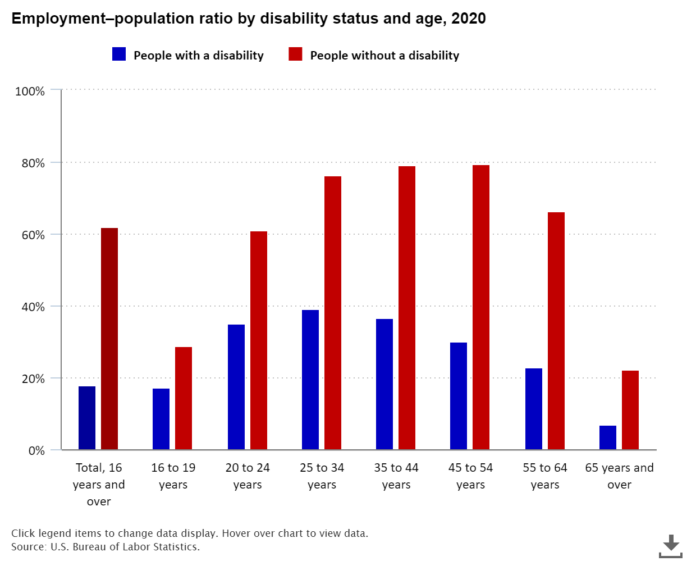
The employment–population ratio—that is, the percentage of the population that is employed—for people with a disability was 17.9 percent in 2020, a decrease from 19.3 percent in 2019. The ratio for people without a disability was 61.8 percent in 2020, down from 66.3 percent in the prior year. Data for 2020 reflect the effect of the COVID-19 pandemic and efforts to contain it.
The lower employment–population ratio among people with a disability reflects, in part, the older age profile of people with a disability; older workers are less likely to be employed regardless of disability status. However, across all age groups, people with a disability were much less likely to be employed than those with no disability.
Among people with a disability, the employment–population ratio was highest for those ages 25 to 34, at 39.1 percent. The ratio for those ages 35 to 44 was 36.7 percent, and the ratio then decreased for each older age group. For those age 65 and older, the employment–population ratio for people with a disability (6.9 percent) was about one-third the rate of those without a disability (22.2 percent). By comparison, the employment–population ratio for those with no disability was highest for those 45 to 54 years old, and then decreased as age increased as well.
Source: https://www.bls.gov/opub/ted/2021/17-9-percent-of-people-with-a-disability-employed-in-2020.htm
Summary: This data tracks the employment rates of people living with disabilities compared to people without disabilities. The rates for people with disabilities are lower but follow a similar trend. However, their rates start decreasing at 35 while the rates for people without disabilities start decreasing at 55. Also, people who do not work have more time at home, so how are they using their time and what are they getting up to? Designing for the disabled is different because they live a different day to day.


