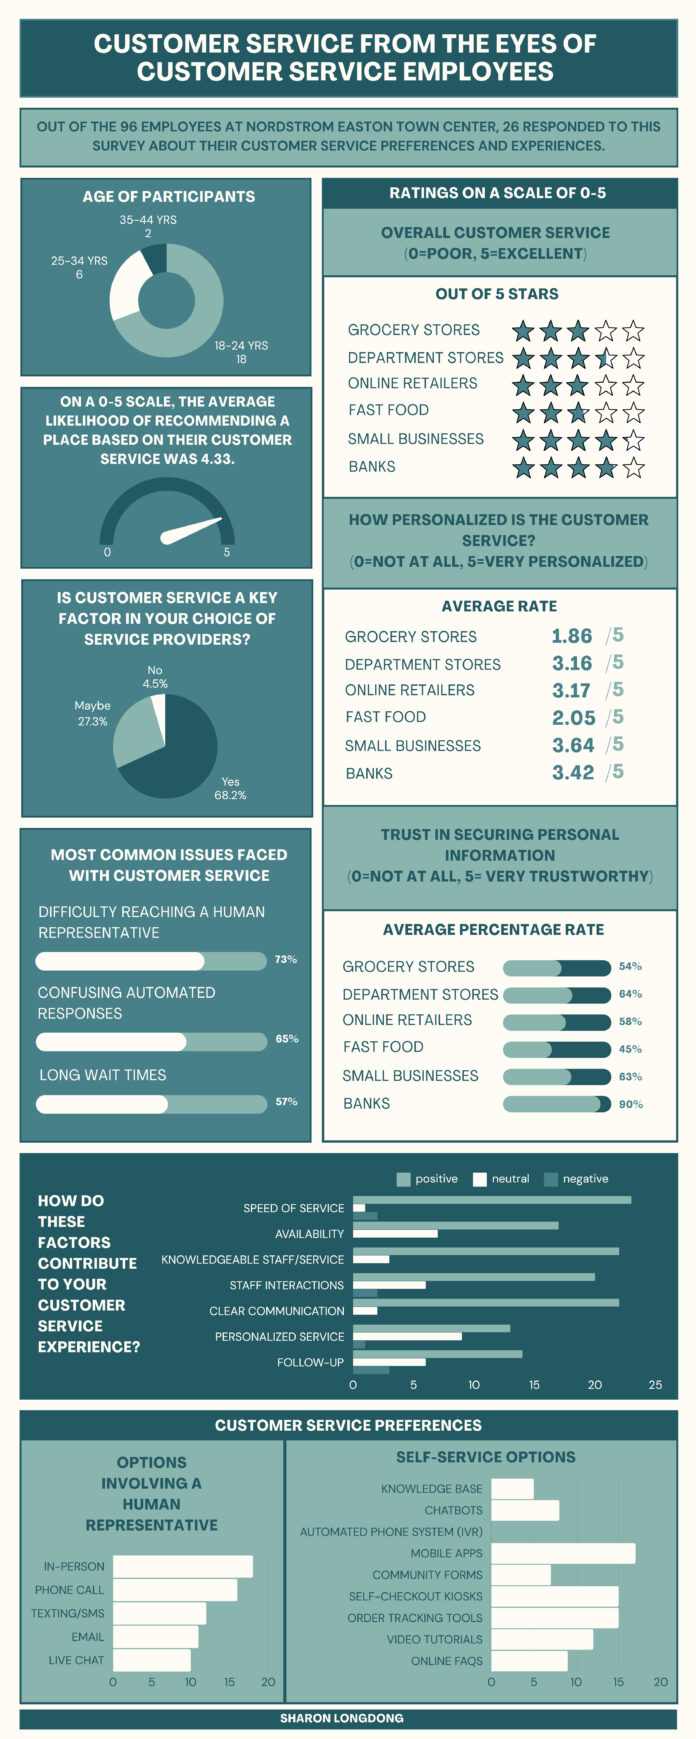
The survey I curated was sent out to the employees of Nordstrom Easton Town Center. Of the 96 currently employed there, I received 26 responses, which equates to around 27% of the store. I sent my survey out to several employees in different departments, including service experience (customer service), men’s apparel, women’s apparel, and fulfillment. I also posted QR codes in spots that all employees typically pass through for one week. All results were recorded anonymously, but after speaking to the employees in these departments I am confident the responses include a good range of the departments the store has.
My survey was intended to gather statistics regarding their general view of customer service, including their experiences from different types of stores and preferences in the form of customer service. My additional primary research involving interviews will provide more qualitative answers about how the employees go about providing customer service and how their experience in the field affects their perception of it at other places.
The visualization above showcases the all results from the survey. For the questions that required the participant to rate stores based on different topics, I presented the average ratings or average percentage rates using different visuals. For questions where they could select multiple choices regarding their preferences and experiences, I used bar graphs to accurately show the overall results.


